
A dashboard gets stronger the more focused it becomes. A handful of figures tracked every week sheds more light on a decision than thirty lines checked once a quarter.
What is more, the SME performance indicators that can actually inform a decision can be counted on one hand, provided you choose them for what they trigger rather than what they measure.
To help you see more clearly, the teams behind our customizable, flexible CRM tell you everything you need to know about the categories of indicators to track, what they reveal and how often to check them.
- Sales activity: the ability to generate new business, to review every week.
- Cash flow: the real short-term room for manoeuvre, also to be tracked every week.
- Profitability: the margin actually generated on each euro invoiced, to measure every month.
- Customer relations: the strength of the existing portfolio, to monitor monthly.
- Internal productivity: the time spent on administrative management, to assess every quarter.
The 5 families of indicators that structure SME management
The indicators useful to an SME fall into 5 families, no more. Each one answers a different question, and covering them all gives a complete view of your company’s health. Here are these 5 families and the most telling indicator for each:
- Sales activity: it is measured first by the quote conversion rate, which tells you whether the bottleneck lies before or after the proposal.
- Cash flow: it is read from the average customer payment time, far more than from today’s bank balance.
- Profitability: it is judged by the margin per deal, not by overall revenue, which hides deals sold at a loss.
- Customer relations: they are monitored through the repeat purchase rate, the only figure that distinguishes healthy growth from a headlong rush.
- Internal productivity: it shows in the time spent re-keying data and on administrative tasks.

In the SMEs we support, the initial dashboard grew through one-off requests that were never cleaned up. After review, it fits on a handful of lines.
How often should you track your performance indicators?
The ideal tracking frequency depends on the reaction time each indicator allows: a figure you can only correct within 6 months does not warrant weekly tracking, whereas deteriorating cash flow shows within days. So match the pace to how quickly you can act.
In practice, sales activity and cash flow call for a weekly review, because a week’s delay already costs deals or cash.
Profitability and customer relations, for their part, are monthly topics, once the accounting entries have stabilized.

On the sales side, our article on sales performance indicators details this breakdown step by step through the pipeline.
Cirrus Shield: from spreadsheet to a continuously updated dashboard
A classic spreadsheet reaches its limit as soon as 2 people update it. Versions diverge, formulas break, and the manager makes decisions on figures that are 3 weeks old.
So we designed Cirrus Shield so that indicators are calculated from data already entered, with no re-keying or manual consolidation.
Quotes, invoices, reminders and customer exchanges feed directly into continuously updated dashboards, which each manager filters according to their scope.
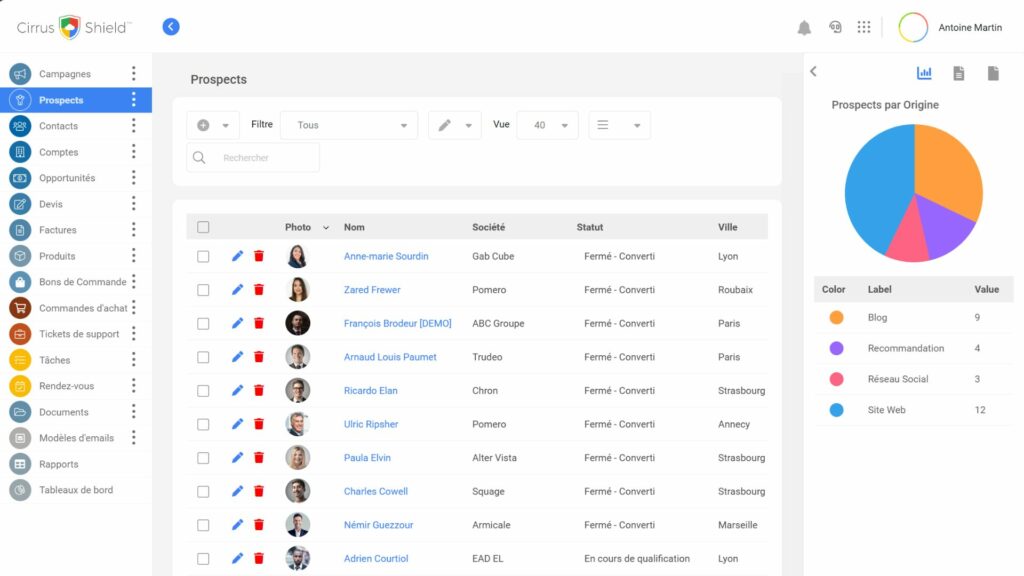
The low-code approach lets you build your own views without writing a line of code, and therefore without depending on a provider every time your needs change.
Thousands of users now manage their business this way, with pricing designed for SMEs.
Managers first ask us for accurate figures, updated every day, on which they can base a decision that same morning.
FAQ – SME performance indicators
How many indicators should an SME track?
An SME usefully tracks between 5 and 8 indicators. Beyond that, reading time exceeds decision time and the dashboard loses its original purpose. It is better to have 6 figures updated every week than 25 lines checked twice a year.
What is the difference between a KPI and a simple management figure?
A KPI triggers an action; a management figure describes a situation. Monthly revenue describes; the quote conversion rate triggers: if it drops, you know what to fix. This distinction keeps the dashboard focused on data that calls for a decision.
Do you need specific software to track your performance indicators?
Yes, from the very first indicators tracked. A tool connected to quotes, invoices and payments calculates the figures for you and keeps them continuously up to date. The benefit grows with the business: from the solo manager who saves several hours a month to the whole team sharing the same view.
Which indicators should you track first when starting a business?
Start by tracking 2 figures: the quote conversion rate and the average customer payment time. The first reveals your sales health, the second the health of your cash flow. These 2 indicators are enough to detect most difficulties before they show up on the balance sheet.
How do you know if an indicator is useless?
Ask yourself a simple question: what decision has this figure changed in the last 12 months? If the answer is none, remove it from the dashboard. An indicator that has never triggered a decision takes up space without adding anything.
- Les tableaux de bord de gestion (Management dashboards), Bpifrance Création
- Le tableau de bord, l’outil pour piloter votre entreprise (The dashboard, the tool for running your business), Bpifrance Création
- Les KPI clés pour optimiser la performance de votre entreprise (Key KPIs to optimize your business performance), CCI Lyon Métropole

