Reporting
Prospecting reports Sales follow-up reports Custom reports Marketing reports Dashboards
To make the right decisions at the right time, you must be able to leverage your CRM data. Cirrus Shield allows you to create the most suitable custom reports and dashboards for your company and enables all members of your organization to access them, whether on a PC, tablet, or smartphone.
Cirrus Shield offers a set of standard reports to track your sales process. However, the report creation wizard allows you to create custom reports according to your needs.
Prospecting Reports
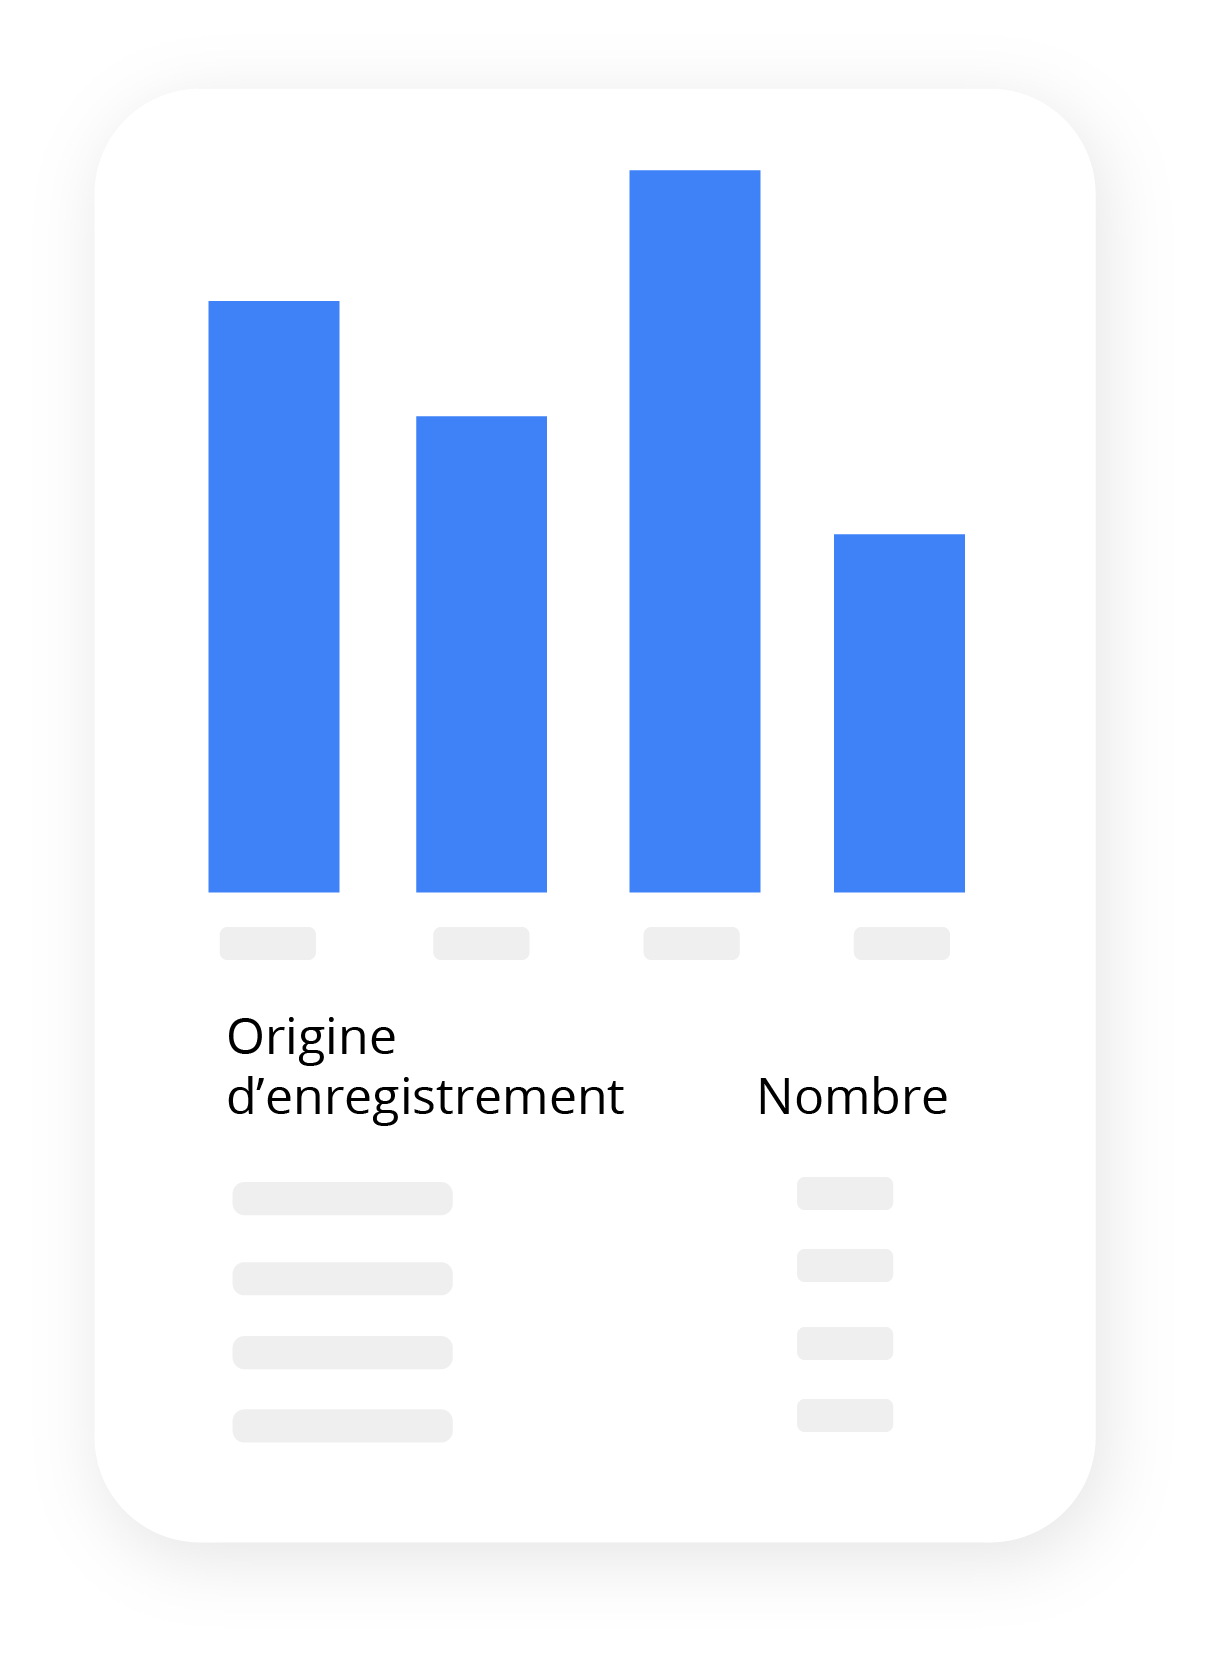
Prospects by source
This report allows you to quantify prospects for each of the sources that allow you to generate them. This analysis can be done quantitatively by studying the number of prospects by source, or qualitatively by studying the profitability of each source. Thus, you can better invest your sales time to concentrate on the most effective approaches.
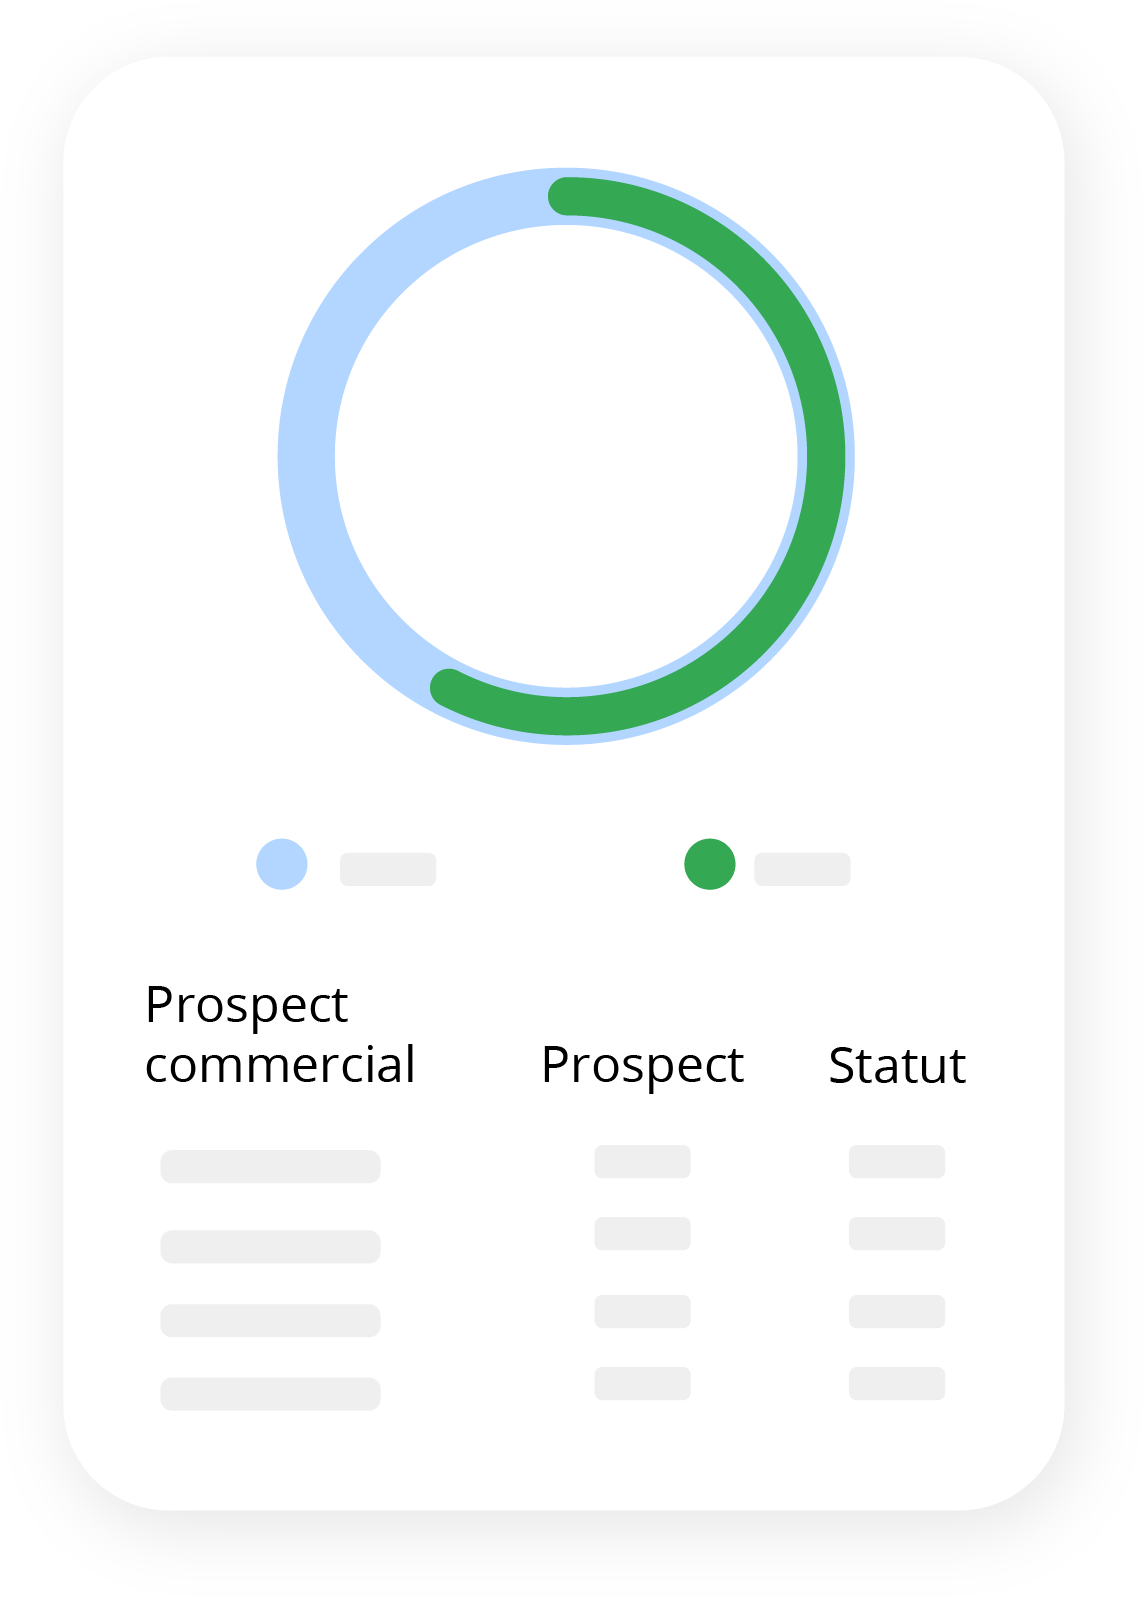
Team prospect tracking
To best manage your sales teams’ workload, you must be able to distribute prospects in a balanced way. The prospect tracking report by salesperson gives you visibility on the prospects currently in progress or those that have been processed, by salesperson.
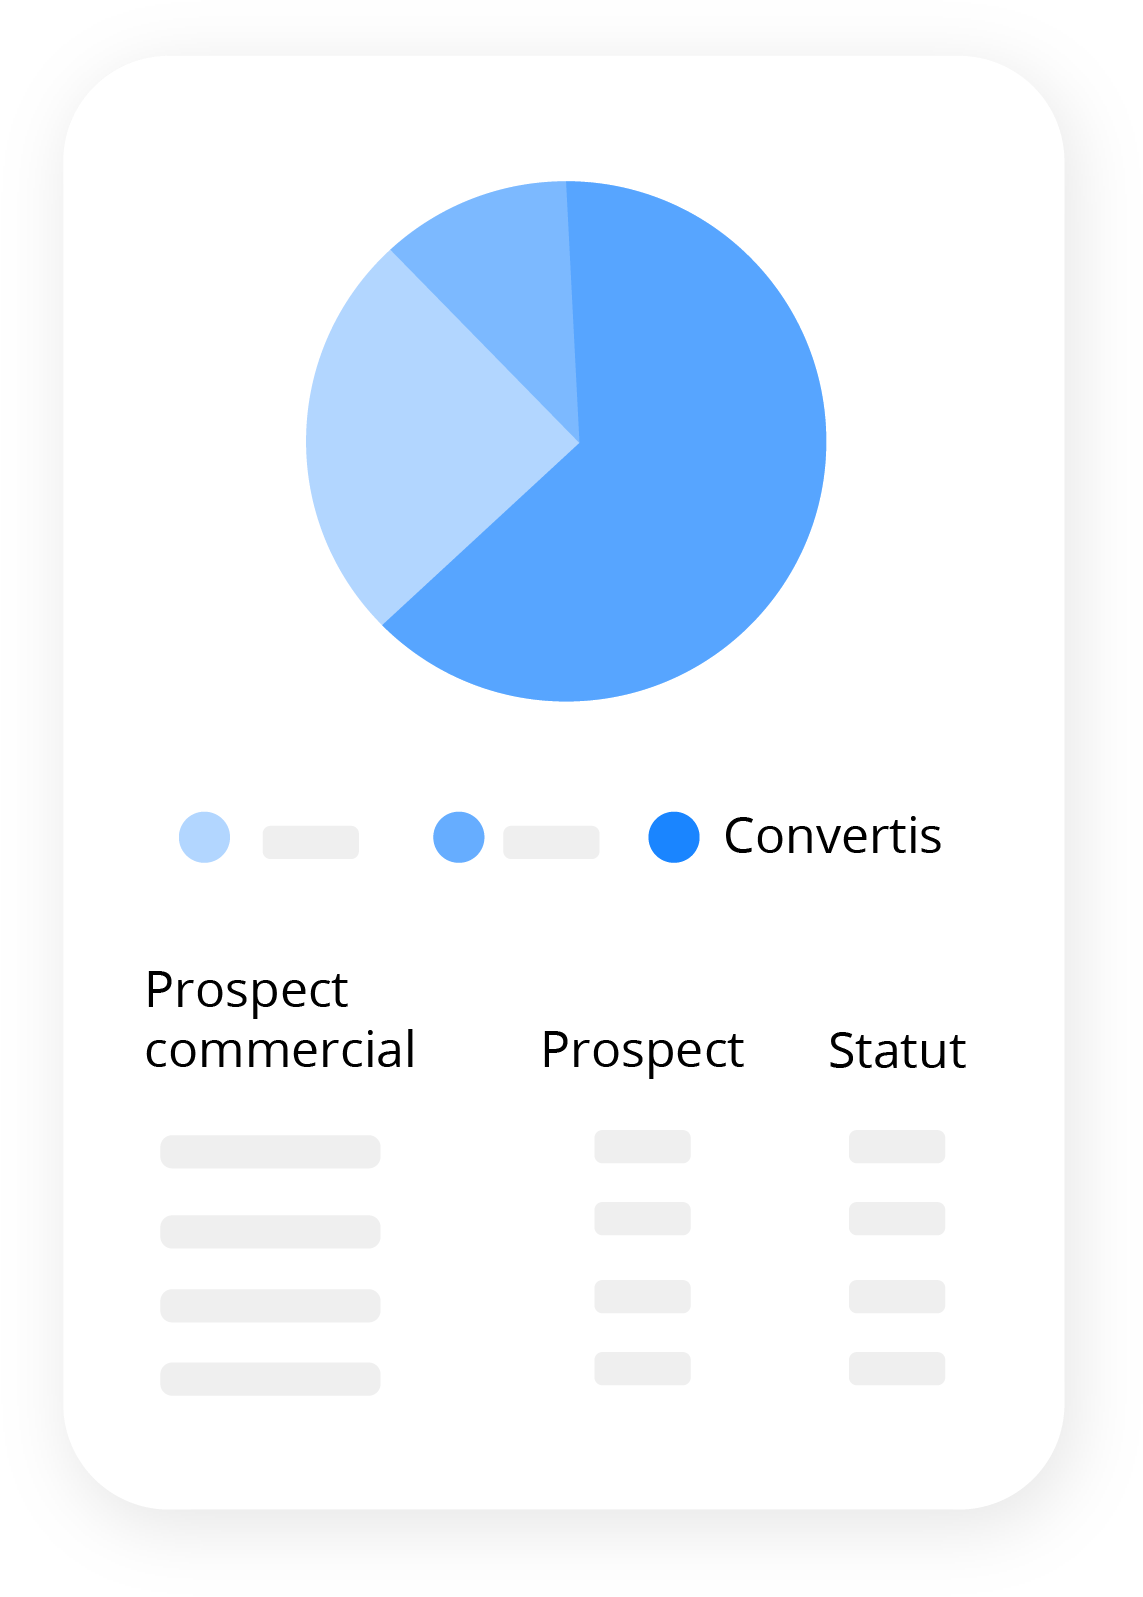
Converted prospects
Conversion is a key step in the sales process. Tracking it allows you to evaluate your effectiveness at several levels: what is the success rate of the salespeople? Are we focusing on the right targets? Are we converting enough prospects to meet our sales objectives?
Prospects by segment
It will be important to define your customer segmentation, whether it is based on your clients’ industry sector, company size, or any other factor or combination of factors. Once this is done, tracking the effectiveness of your prospecting on different targets will allow you to evaluate the accuracy of your segmentation (Are we focusing on the right targets?) and the attractiveness of your offer for the different targets. By performing this analysis early in your pipeline, you can adjust your targeting before wasting too much effort trying to convert segments that are not your market.

Reports on sales follow-up
Reports on sales follow-up allow you to evaluate the sales performance of your teams. They are a central tool in management by sales team managers.
Opportunities in progress
The main tool for leading a sales meeting, the in-progress opportunities report gives you an overview of your sales pipeline. It can be broken down by salesperson, by month, or by year depending on the average length of your sales cycle. It is the favorite tool of sales managers because it allows them to analyze the strengths and weaknesses of each person’s sales approach and to personalize the manager’s coaching for each salesperson.
Lost opportunities
Understanding why we lost an opportunity is essential in the continuous improvement process of sales-related operating modes. The volume of lost business should be compared with that of won business to calculate the ratio of won deals to lost deals.
Won opportunities
The won opportunities report allows you to quantify the volume of Revenue you bring to the company. It can be tracked by month, by year, or by salesperson. It also allows you to initiate the sales administration process.
Best-selling products and services
For companies with a short sales cycle, this report helps identify the most successful products or services and seasonal trends. For those with longer sales cycles, identifying trends allows the offer to be adapted in advance to meet new market demands.
Reports for the marketing function

Campaign tracking
For email campaigns carried out with an emailing tool connected to Cirrus Shield (such as Sendinblue, Mailchimp…), the reports will allow you to get a summary view of opens and clicks in order to trigger your sales process actions. For trade shows, reports on campaigns will allow you to list the prospects generated by the campaign and to track them accordingly. You can also create reports on any other type of campaign.

Response rate by segment
In the same way as for prospects, you can identify with Cirrus Shield the response rate (in clicks, in number of prospects generated, or any other indicator) by segment in order to see which targets are most responsive to your offers or your marketing messages. You can thus adapt your marketing approach based on the results.
Custom Reports

Filtering criteria
Cirrus Shield allows you to define filtering criteria on any field of the module you are reporting on, but our solution also allows you to define filtering criteria on all fields from modules linked to the module you are reporting on. For example, if you want to run a report on opportunities, you can define filtering criteria on any field of the society associated with that opportunity.
Groupings and totalizations
In Cirrus Shield, you can create simple reports or reports with groupings. Select up to three grouping fields (for example: opportunities by territory by salesperson and by month) and choose the fields on which you want to perform a totalization. A totalization allows you to calculate the sum or average of a field on the grouping fields, for example, the opportunity amount.


Customizable charts
Each report can be accompanied by a chart to represent the data synthetically. Cirrus Shield offers you the ability to choose between different types of charts: pie charts, histograms, line.
Roles and profiles
When a user runs a report, the data displayed in that report is only the data they have access to. You can also restrict the report export right.


Export the report to Excel format
Cirrus Shield reports are exportable to Excel format. You can thus export the data for reprocessing, for example, in a Business Intelligence tool.
Dashboards

Custom dashboards
Cirrus Shield’s custom dashboards allow you to aggregate a set of charts representing the indicators of your choice. You can create as many dashboards as you wish and group indicators by theme: sales, marketing, customer service, invoicing, etc.
You have 3 types of charts available: pie charts, histograms, and line charts.

View dashboards
It is sometimes necessary to have an overview of a particular indicator while you are working, whether it’s on your prospecting, your billing, or any other activity related to your CRM. Cirrus Shield allows you to display dashboards at the view level, so you can see the impact of your actions on an indicator without leaving your screen.
Tailored Pricing
Select the version best suited to your needs.
ENTREPTISE
50€ Excl. VAT/mnth
for 2 users
+ 49€ Excl. VAT per additional user per month
ULTIMATE
75€ Excl. VAT/mnth
for 2 users
+ 75€ Excl. VAT per additional user per month